This is Part 2 of a 4-part series on HFTSignal. Part 1 covered building and saving a strategy definition. A saved strategy on its own never runs anywhere — to backtest a trading strategy in India on HFTSignal, you first bundle it into a Trading Setup, then launch that setup in Backtest mode. This post covers both steps: building the setup, and reading what the backtest tells you.
What Is a Trading Setup on HFTSignal?
A Trading Setup is the bundle that combines a saved strategy, a broker account, a date range, and a single run mode into one launchable unit. A strategy defines the rules; a Trading Setup defines who runs those rules, on what data, and in what mode.
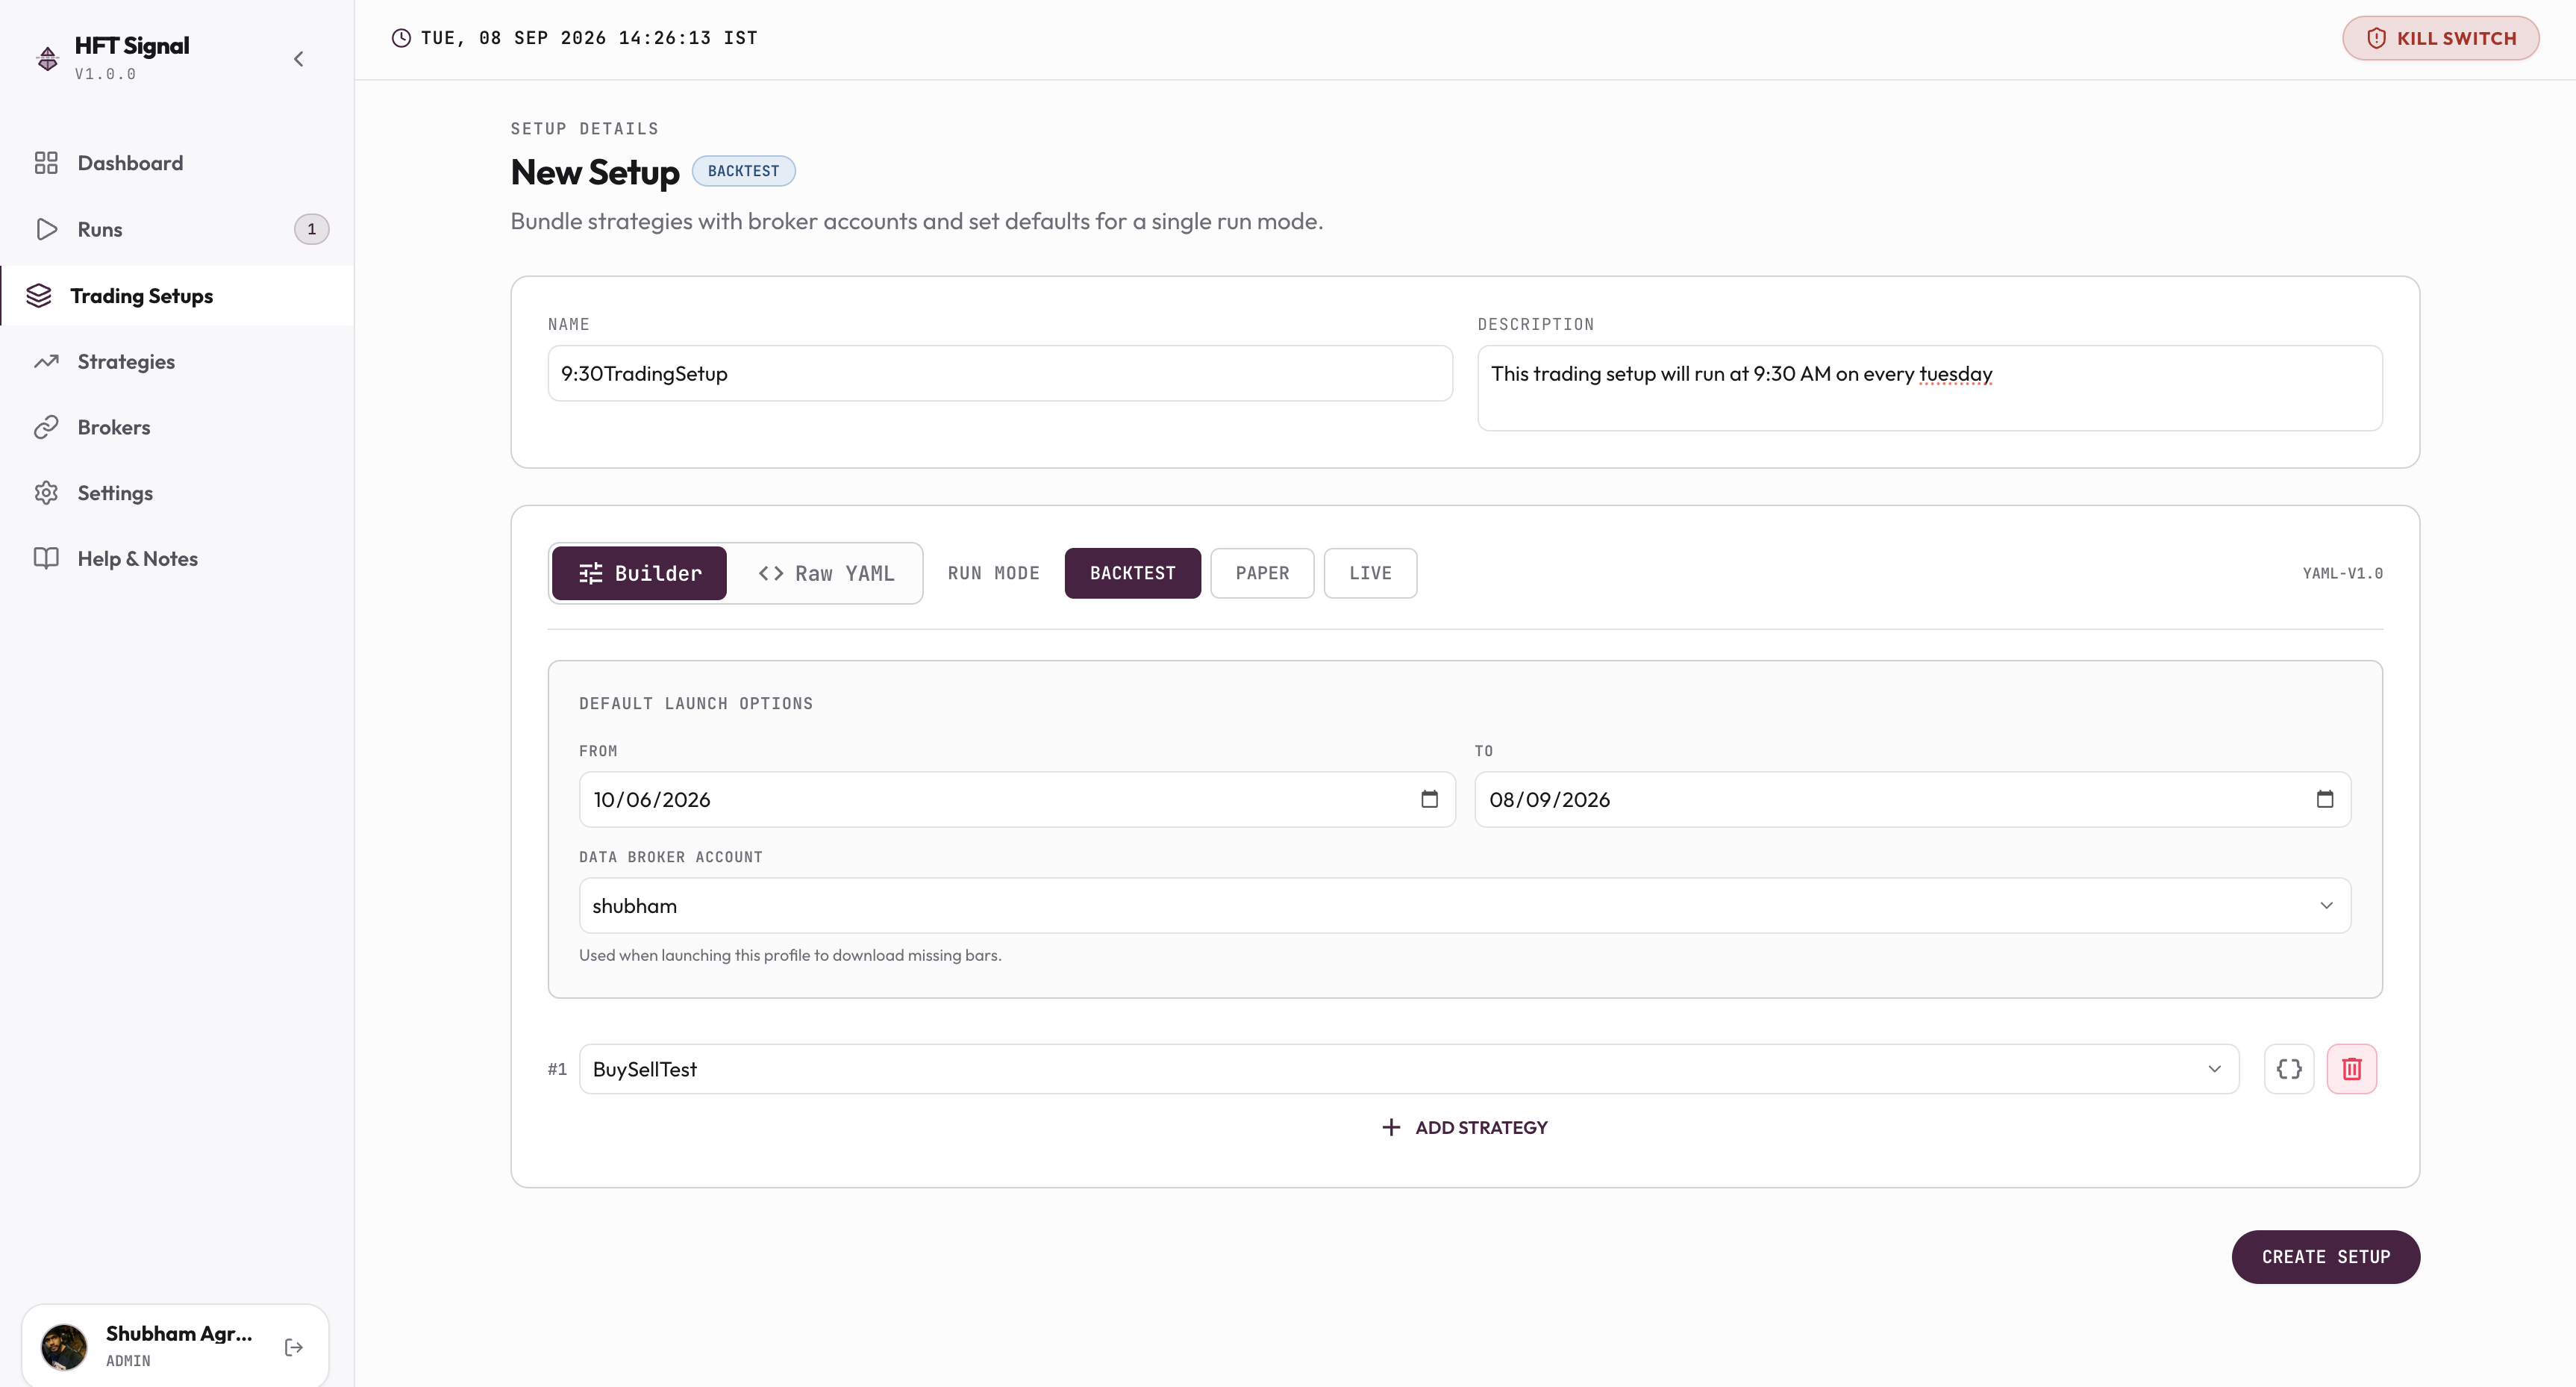
| Field | What it does |
|---|---|
| Name | A label for the setup, such as “9:30TradingSetup” |
| Description | A plain-text note describing what the setup is for and when it runs |
| Run Mode | Backtest, Paper, or Live — set once per setup |
| From / To | The date range a Backtest run downloads historical data for |
| Data Broker Account | The connected broker account used to fetch price bars for the backtest |
| Strategy rows | One or more saved strategies attached to this setup, added via “Add Strategy” |
Like the strategy configuration screen from Part 1, this screen has a Builder and a Raw YAML toggle for the same settings, and the Kill Switch stays visible in the top corner throughout.
How Do I Create a Trading Setup?
Creating a Trading Setup means filling in five things: a name, a description, a run mode, a date range with a data broker account, and at least one strategy. Name and description are free text — the example above uses a name that states the run schedule directly (“9:30TradingSetup”) rather than something generic, which makes the setup easier to identify later in the Runs list. Run Mode is a three-way toggle; selecting Backtest here means every launch of this setup runs against historical data until you change it. From and To set the historical window the backtest pulls data for, and Data Broker Account picks which connected broker supplies that historical data — this account is used for data only, not for placing orders. Strategies are attached one at a time with “Add Strategy,” each shown as a numbered row (#1, #2, and so on), and every strategy in the setup shares the same date range, broker account, and run mode. Clicking Create Setup saves the bundle without launching it.
What Do Backtest, Paper, and Live Mean for a Trading Setup?
Backtest, Paper, and Live are the three run modes a Trading Setup can launch in, and the mode is set once per setup rather than once per run.
| Mode | Data used | Orders placed | Real money at risk |
|---|---|---|---|
| Backtest | Historical price data for the selected date range | Simulated against past data | No |
| Paper | Live market prices | Simulated | No |
| Live | Live market prices | Real orders through the connected broker | Yes |
This post covers Backtest mode only. Paper and Live modes, including connecting a broker for order placement rather than just data, are covered later in this series.
How Do I Read My Backtest Results?
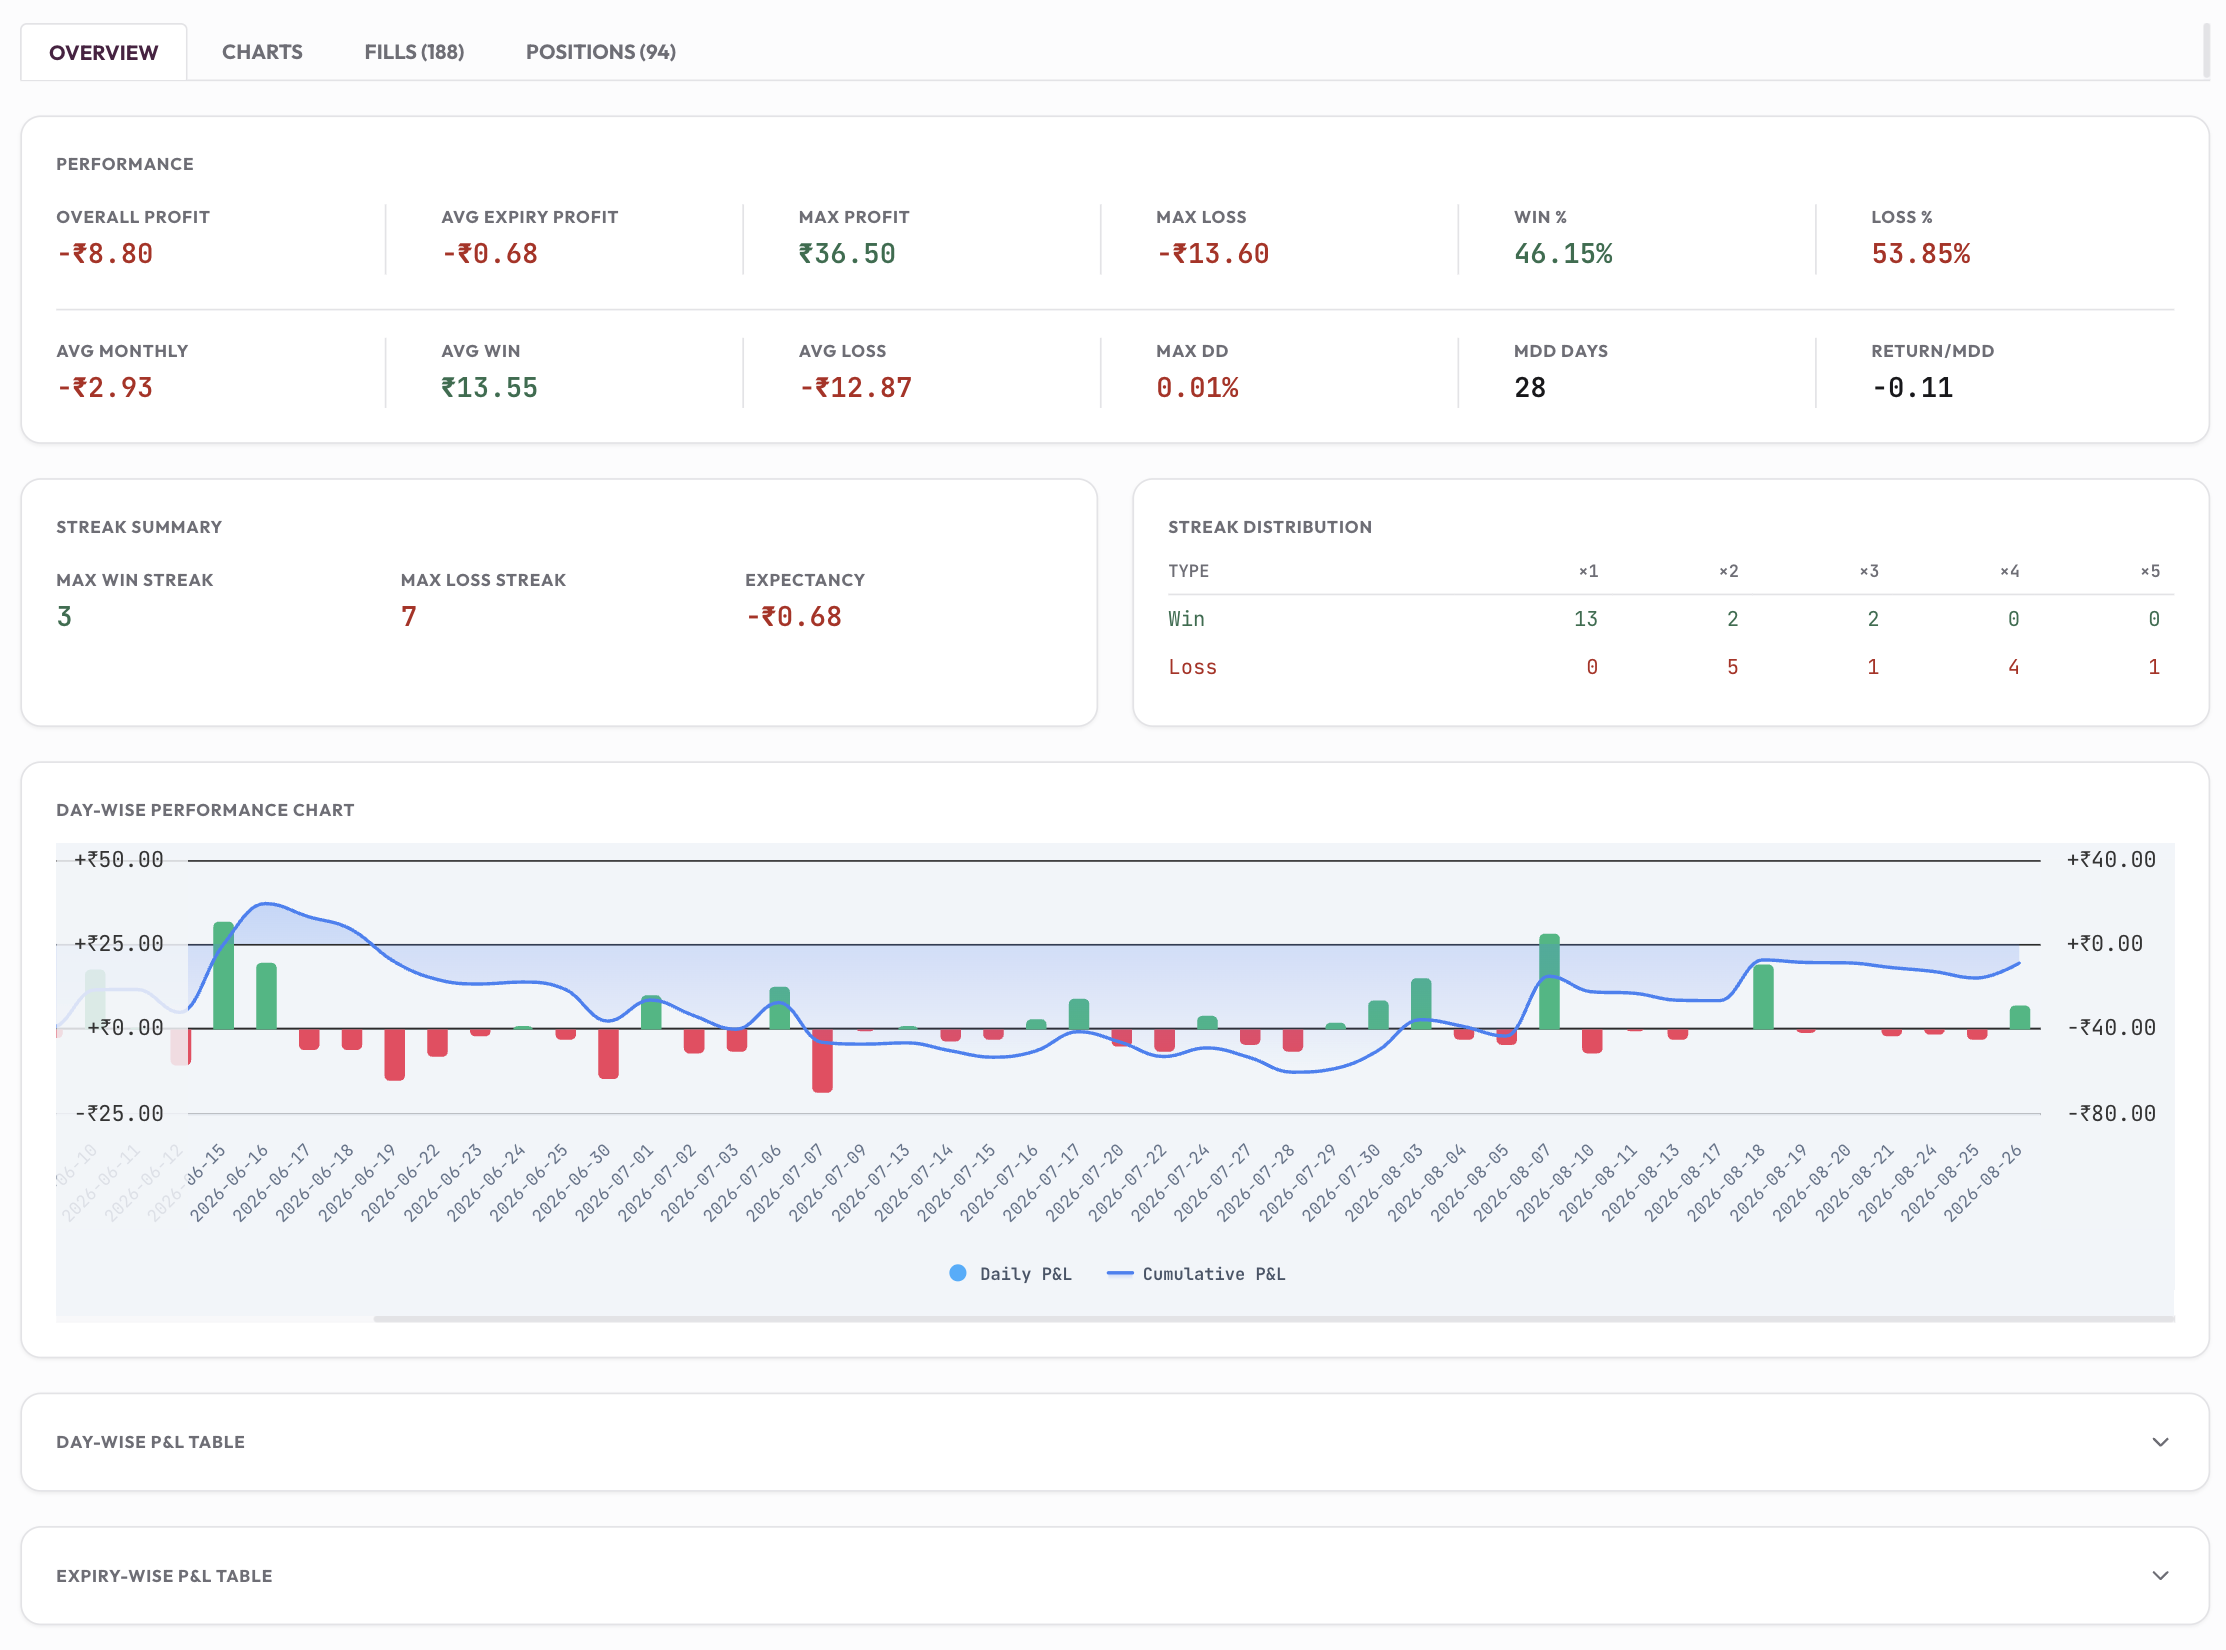
A finished backtest opens on an Overview tab showing performance metrics, streak data, and a day-wise P&L chart, with separate tabs for Charts, Fills, and Positions.
| Metric | What it means |
|---|---|
| Overall Profit | Total profit or loss across every trade in the selected date range |
| Win % / Loss % | Share of trades that closed profitably versus at a loss |
| Max Profit / Max Loss | The single best trade and the single worst trade in the backtest |
| Avg Win / Avg Loss | The average profit on winning trades and the average loss on losing trades |
| Max Drawdown (Max DD) | The largest peak-to-trough decline in cumulative P&L during the period |
| MDD Days | How many days the strategy spent below its prior peak before recovering |
| Expectancy | The average profit or loss expected per trade, blending win rate with average win and loss size |
| Max Win Streak / Max Loss Streak | The longest consecutive run of winning trades, and of losing trades |
The Fills tab lists every individual order execution (188 in this run); the Positions tab lists completed round-trip trades built from those fills (94 in this run). The Day-wise Performance Chart plots daily P&L as bars against cumulative P&L as a line, so a strategy that is trending down overall but still has green days is easy to distinguish from one that is losing steadily.
Is a Backtest Result a Guarantee of Future Performance?
A backtest result is not a guarantee of future performance and is not investment advice. It reflects how a strategy’s rules would have performed against historical price data for the exact date range selected, using the assumptions built into the simulation. Past performance shown in any backtest, including a positive one, does not predict what the same strategy will do in live markets.
What’s Next After Running a Backtest?
Running a backtest is Part 2 of a four-part series. Two parts remain.
| Part | Covers |
|---|---|
| Part 1 | Build Strategy — building and saving a strategy definition |
| Part 2 (this post) | Build Trading Setup and Run Backtest — bundling a strategy with a broker account and date range, then reading the results |
| Part 3 | Setting up Broker — connecting your broker account, starting with Zerodha Kite |
| Part 4 | Paper Trade and Live Trade — running a Trading Setup on live prices with simulated orders, then going live |
FAQs
What is a Trading Setup on HFTSignal?
A Trading Setup bundles one or more saved strategies with a broker account, a date range, and a single run mode — Backtest, Paper, or Live. It’s the unit you actually launch; a saved strategy by itself never places an order.
Do I need a broker connected to run a backtest?
Yes, but only as a data source. A backtest downloads historical price bars using the connected broker account you select under Data Broker Account. It does not place any order through that broker.
What does Win % and Max Drawdown mean in a backtest result?
Win % is the share of trades that closed profitably out of the total trades taken. Max Drawdown is the largest percentage decline from a peak in cumulative P&L to the lowest point that followed it, before a new peak was reached.
Can one Trading Setup run more than one strategy?
Yes. Each strategy is added as a numbered row inside the same Trading Setup, and every strategy in that setup shares the same date range, broker account, and run mode.
Shubham Agrawal
HFTSignal researches strategy templates and builds the execution infrastructure Indian retail traders tune and deploy on their own broker.
Related Posts
Try HFTSignal
We research the strategy templates. You tune the parameters. Deploy on your own broker — no code required.
Start for free →